 Gambling
related articles
Modelling Results of AFL Games
Part 1
By Scott McIntosh
(Access AFL calculator from Part
2 of this series)
Introduction
You think that Collingwood is under-rated and want to have a bet on them.
But what is the best bet? Straight up? On the line? A margin bet?
In this article I will introduce a relatively simple but robust model
that can be used for determining probabilites and odds of the final score
difference for the game of Australian Rules Football. The model uses a
normal distribution probability distribution fuction, given a mean and
standard deviation. In future articles I will explain how this model can
be used to calculate different probabilities and odds associated with the
final score difference (eg under/over 39.5 points margin bets).
Mean
The mean represents the average winning margin. A reasonably accurate
mean is given by the bookmakers in the form of the "line" bet.
Alternatively, handicappers may determine their own mean, an example of
which is the Swinburne computer predictions.
Standard Deviation
The standard deviation represents how far actual results deviate from the
mean. Using historical data of bookmakers lines and actual results the
standard deviation of AFL match results is found to be approximately 38.
Other good handicapping models of predicting the mean result have the
same, or very similar, standard deviation.
Normality
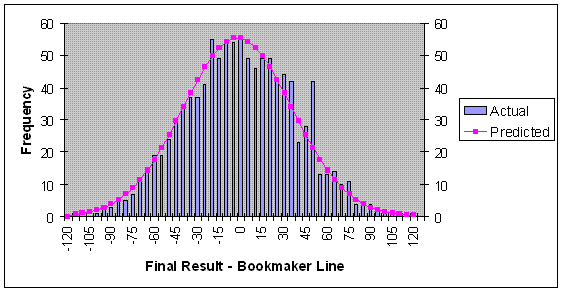
The graph below illistrates how well actual results correspond to the
normal distribution model, where mean equals bookmakers line and standard
deviation equals 38. A positive difference between the final result and
bookmakers line represents the home beating the line whereas a negitive
difference represents the away team beating the line. Statistical tests
confirm that the normal distribution assumption is reasonable.
Graph 1:
Difference between final result and bookmakers line
(1,056 Home and Away Games : 2000 - 2005)

Limitations
Whilst this model is quite accurate it assumes the standard deviation is
the same for all games. The model does not take into account factors like
weather, team playing styles or rule changes, all of which may have an
effect on standard deviation. Despite this limitation, for its simplicity
the normal distribution model of AFL football results is quite powerful
and is probably the best starting point for more complex models.
Conclusion
Although this article is a bit more technical than I would have liked it
provides a good foundation for future articles where I will describe some
practical applications of the normal distribution model of AFL football.
By using a spreadsheet program such as Excel, a good estimate of
probabilities and odds can be calculated for many bet types offered by
bookmakers.
Scott McIntosh runs the website Online Poker Room Reviews
Proceed
to Part 2 of this series
Articles index
Home|FAQs|Disclaimer|Contact
Us
©2000 to present.
OZmium Pty Ltd. All rights reserved